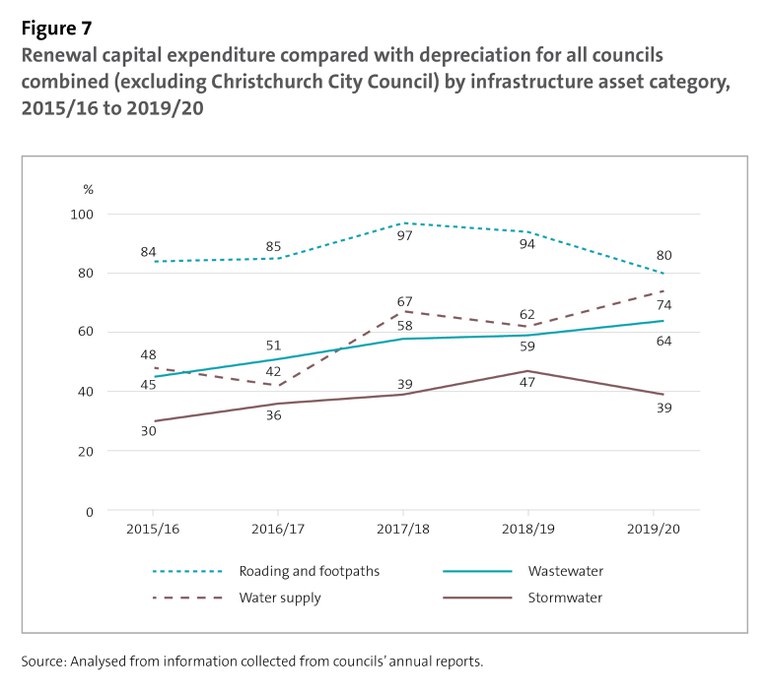
Figure 7 - Renewal capital expenditure compared with depreciation for all councils combined (excluding Christchurch City Council) by infrastructure asset category, 2015/16 to 2019/20
This figure shows a line graph with percentage points on the y-axis and financial years on the x-axis. The graph shows that roading and footpaths renewals have been consistently above 80% of depreciation since 2015/16. Water supply and wastewater renewals have ranged between 42% and 74% since 2015/16, with the percentage being greater for water supply for all years except for 2016/17. The graph also shows that renewals have been consistently lower for stormwater than for other infrastructure assets, since 2015/16 (ranging from 30% to 47%).
https://www.oag.parliament.nz/2021/local-govt/media-kit/figure7.jpg/view
https://www.oag.parliament.nz/2021/local-govt/media-kit/figure7.jpg/@@download/image/figure7.jpg
Figure 7 - Renewal capital expenditure compared with depreciation for all councils combined (excluding Christchurch City Council) by infrastructure asset category, 2015/16 to 2019/20
This figure shows a line graph with percentage points on the y-axis and financial years on the x-axis. The graph shows that roading and footpaths renewals have been consistently above 80% of depreciation since 2015/16. Water supply and wastewater renewals have ranged between 42% and 74% since 2015/16, with the percentage being greater for water supply for all years except for 2016/17. The graph also shows that renewals have been consistently lower for stormwater than for other infrastructure assets, since 2015/16 (ranging from 30% to 47%).


