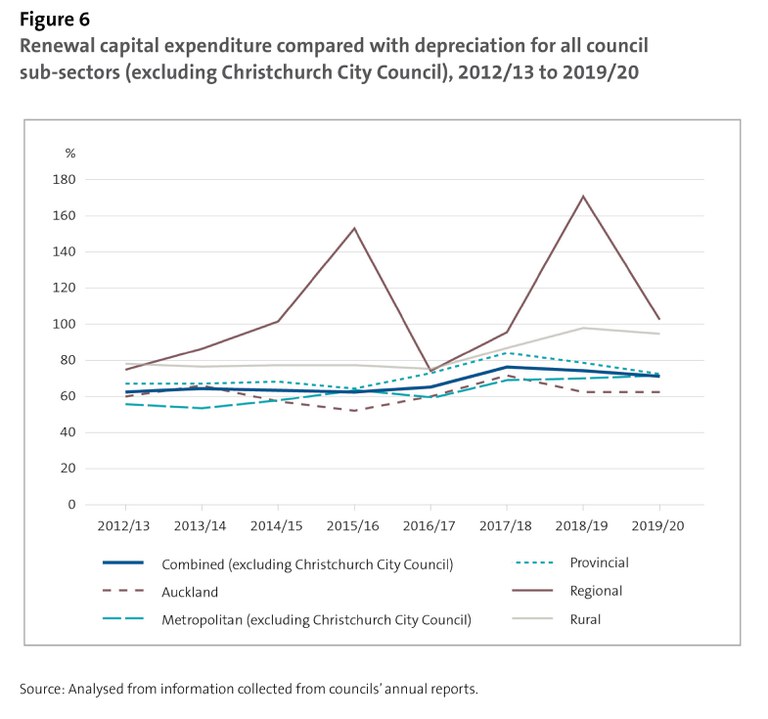
Figure 6 - Renewal capital expenditure compared with depreciation for all council sub-sectors (excluding Christchurch City Council), 2012/13 to 2019/20
This figure shows a line graph with percentage points on the y-axis and financial years on the x-axis. There are six lines on the graph. One line shows all councils combined (excluding Christchurch City Council). The main outliers from that line are regional councils and rural councils. Other sub-sectors – Auckland, Metropolitan, and Provincial show broadly the same trend as the line for all councils.
https://www.oag.parliament.nz/2021/local-govt/media-kit/figure6.jpg/view
https://www.oag.parliament.nz/2021/local-govt/media-kit/figure6.jpg/@@download/image/figure6.jpg
Figure 6 - Renewal capital expenditure compared with depreciation for all council sub-sectors (excluding Christchurch City Council), 2012/13 to 2019/20
This figure shows a line graph with percentage points on the y-axis and financial years on the x-axis. There are six lines on the graph. One line shows all councils combined (excluding Christchurch City Council). The main outliers from that line are regional councils and rural councils. Other sub-sectors – Auckland, Metropolitan, and Provincial show broadly the same trend as the line for all councils.


