Part 2: Councils' investment in infrastructure
2.1
In this Part, we consider how well councils reinvested in their assets, reported on their three waters assets performance measures, delivered on their 2019/20 capital expenditure budgets, and built assets needed for growth.10 Because councils generally use debt to fund capital expenditure, we have also considered the debt owed by the sector as at 30 June 2020.
2.2
In our analysis, we considered the local government sector as a whole and, in some cases, as five sub-sectors. The sub-sectors were:
- metropolitan councils;
- Auckland Council (considered separately from other metropolitan councils because of its size);
- provincial councils;
- regional councils; and
- rural councils.
2.3
The most significant result continues to be the level of asset reinvestment. Councils' renewal capital expenditure in 2019/20 was 74% of depreciation for the year. This continues a trend that we have been reporting since 2012/13, which indicates that councils are not adequately reinvesting in their assets. Further, councils spent $1.38 billion (21%) less than they planned to on their assets.
2.4
An increasing number of councils have acknowledged in their 2021-31 long-term plan (LTP) consultation documents that they have been underinvesting in their assets.
Reinvestment in councils' assets during 2019/20
2.5
To consider how well councils are reinvesting in their assets, we compared capital expenditure on renewals with the annual depreciation charge. We consider depreciation to be the best estimate of the portion of the asset that was "used up" during the financial year. Assets have long life-cycles, so this is only one indicator of whether councils are adequately reinvesting in their assets.
2.6
Overall, based on our analysis, we remain concerned that councils might not be adequately reinvesting in critical assets. If councils continue to underinvest in their assets, there is a heightened risk of asset failure and resultant reduction in service levels, which will negatively affect community well-being.
2.7
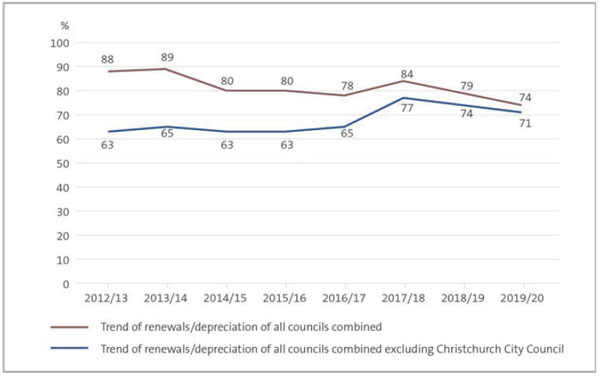
In 2019/20, all councils' renewal capital expenditure was 74% of depreciation (this was 79% in 2018/19). This means that, for every $1 of assets used up, councils were reinvesting 74 cents. For 22 councils, renewal capital expenditure was more than 100% of depreciation. This is slightly fewer than the 29 councils for which this was the case in 2018/19.
2.8
Figure 5 compares renewal capital expenditure with depreciation for all councils, from 2012/13 to 2019/20. There are two lines on the graph. One line includes all councils, and the other excludes Christchurch City Council.
2.9
Christchurch City Council's renewal capital expenditure is proportionately higher than other councils because of the rebuilding work it has done since the 2011 Canterbury earthquakes.
Figure 5
Renewal capital expenditure compared with depreciation for all councils, 2012/13 to 2019/20

Source: Analysed from information collected from councils' annual reports.
2.10
During the past eight years, renewals ranged between 74% and 89% of depreciation for all councils. However, the effect of Christchurch City Council's rebuild after the Canterbury earthquakes did not give an accurate picture of how much all councils were investing in renewals, mainly from 2012/13 to 2016/17. Overall, there was a change between 2016/17 and 2017/18 where councils' renewal investment significantly increased, but this has declined since 2017/18.
2.11
In 2019, we reported that councils were forecasting, in their 2018-28 LTPs, an increase in what they were proposing to spend to renew their assets.11 All councils, excluding Christchurch City Council, had planned renewing assets at over 80% of the depreciation expense for the 2018/19 and 2019/20 financial years. Figure 5 shows that this has not occurred.
2.12
Councils are currently preparing their 2021-31 LTPs. We intend to analyse these plans to see how councils are planning to catch up on any previous underinvestment in their assets and will report on our analysis.
2.13
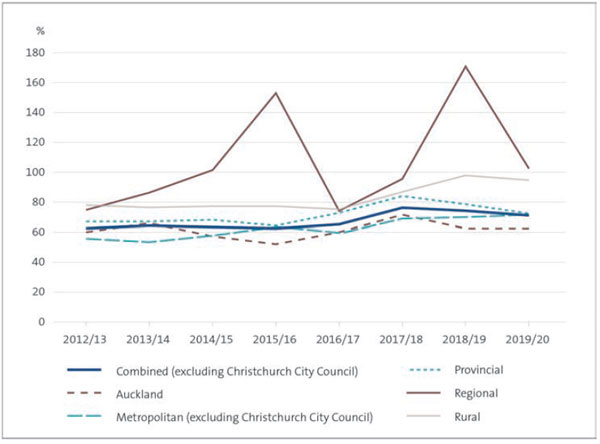
When considering council sub-sectors (see Figure 6), and excluding Christchurch City Council, two sub-sectors have a different trend to that shown for all councils.
Figure 6
Renewal capital expenditure compared with depreciation for all council sub-sectors (excluding Christchurch City Council), 2012/13 to 2019/20

Source: Analysed from information collected from councils' annual reports.
2.14
Regional councils' renewals as a percentage of depreciation ranged from 74% (in 2012/13) to 170% (in 2018/19), then dropped to 103% in 2019/20. Greater Wellington Regional Council replacing a significant number of public passenger vehicles during 2018/19 affected that year's figure. Environment Canterbury's replacement of its head office building was the main factor for the peak in 2015/16.
2.15
Rural councils' renewals as a percentage of depreciation ranged from 75% (in 2016/17) to 98% (in 2018/19), with a small drop to 95% in 2019/20. Roading assets are rural councils' largest asset category. As noted in paragraph 1.13, councils receive a subsidy from Waka Kotahi New Zealand Transport Agency, which is an incentive to replace their roading assets. This funding relationship, along with rural councils' asset mix, might explain why they have a different trend to other council sub-sectors.
2.16
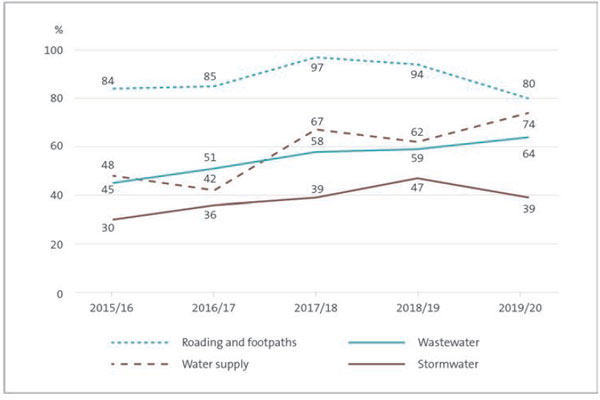
We have also considered 2019/20 renewals expenditure (excluding Christchurch City Council) by infrastructure asset category. Other infrastructure asset classes have the following percentages of renewals spend as a proportion of depreciation in 2019/20 (see Figure 7):
- Roading and Footpaths – renewals spending was 80% of depreciation.
- Water supply – renewals spending was 74% of depreciation.
- Wastewater – renewals spending was 64% of depreciation.
- Stormwater – renewals spending was 39% of depreciation.
Figure 7
Renewal capital expenditure compared with depreciation for all councils combined (excluding Christchurch City Council) by infrastructure asset category, 2015/16 to 2019/20

Source: Analysed from information collected from councils' annual reports.
2.17
It is evident that the level of reinvestment is lower for all three waters assets (drinking water supply, wastewater, and stormwater), compared to roading and footpaths. Over the last two years, the amount reinvested into the three waters assets has also been significantly less than what councils budgeted for in their 2018-28 LTPs. Given the age of some of these networks, we are concerned that councils are more likely to defer reinvestment in their three waters assets than in roading and footpaths. We will continue to look into this as we review councils' 2021-31 LTPs.
2.18
The data also demonstrates that the level of reinvestment is significantly lower for stormwater than for other water assets. This is consistent with the findings of our December 2018 report Managing stormwater systems to reduce the risk of flooding, where we reported that councils were spending less than depreciation on renewing stormwater assets, which might indicate underinvestment. These lower levels of investment could be because there is a tendency for councils to prioritise water supply and wastewater over stormwater, particularly as there are other options to manage stormwater depending on local geography (for example, through discharge to land).
2.19
Although spending on renewals is less than the annual depreciation charge, overall councils have increased capital expenditure on their three waters assets.
2.20
In 2019/20, councils spent $1.7 billion on three waters assets (see Figure 8), which represents 54% of total council spending on infrastructure assets for the year. This is an increase of $385.6 million (29%) from 2018/19. We expect this level of spending to increase in the coming years.
Figure 8
2019/20 spending on three waters assets as a proportion of spending on total infrastructure assets, by capital expenditure type
| Capital expenditure | Three waters assets $million |
Total infrastructure assets $million |
Percentage of total infrastructure spending on three waters assets |
|---|---|---|---|
| Meet additional demand | 614.0 | 838.7 | 73.2 |
| Improve the level of service | 500.5 | 1,045.4 | 47.9 |
| Renew existing assets | 591.7 | 1,270.1 | 46.6 |
| Total | 1,706.2 | 3,154.2 | 54.1 |
Source: Analysed from information collected from councils' annual reports.
Three waters performance measures and trends
2.21
Under the Non-Financial Performance Measures Rules 2013 made by the Secretary for Local Government, councils are required to report their performance against specific performance measures for the three waters (drinking water supply, wastewater, and stormwater). These measures are shown as either "achieved" or "not achieved" in councils' annual reports.
2.22
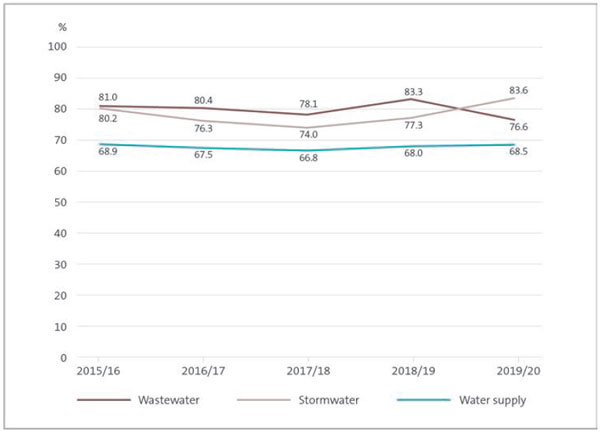
Figure 9 shows that performance for all three waters measures was relatively consistent between 2015/16 and 2018/19. Water supply performance remained consistent into 2019/20. However, the percentage of wastewater measures that were achieved declined from 83.3% in 2018/19 to 76.6% in 2019/20, and the percentage of stormwater measures that were achieved increased from 77.3% in 2018/19 to 83.6% in 2019/20.
Figure 9
Percentage of water supply, wastewater, and stormwater performance measures achieved, 2015/16 to 2019/20

Source: Analysed from information collected from councils' annual reports.
2.23
The consistent performance against the three waters performance measures show that, at this point, the underinvestment in assets is not significantly affecting the levels of service being provided to communities for the sector as a whole. However, these results will be different for individual councils. We also note that assets have long lives and can often sustain a period of underinvestment before levels of service start to decline.
Delivery of capital expenditure budgets
2.24
Most councils did not deliver on their total capital expenditure budgets in 2019/20. This means that some capital projects are either delayed or not being delivered at all, which could affect the levels of service received by communities.
2.25
Councils' total capital expenditure in 2019/20 was $5.14 billion, which was the highest amount councils spent on their assets in the last eight years. However, the amount spent was only about 79% of the $6.52 billion budgeted.12 This is a smaller percentage than in 2018/19, when councils spent 82% of their capital expenditure budgets. The lockdowns in response to Covid-19 are likely to have affected the delivery of some projects.
2.26
On average, all council sub-sectors spent less than 100% of their capital expenditure budgets. The regional council sub-sector was the lowest, spending $142 million or, on average, 56% of their budget. By comparison, Auckland Council spent $2.30 billion or 93% of its budget.
2.27
Looking at individual councils, 52 councils spent less than 80% of their capital expenditure budgets. This continues a pattern we have observed over time (see Figure 10). There were 12 more councils spending less than 80% of budget than in 2018/19. This is the highest number in the last eight years. Covid-19 would have affected the delivery of some projects, but there are also constraints in the availability of contractors, specialists, and associated resources in New Zealand.
Figure 10
Number of councils spending either less than 80%, between 80% and 100%, or over 100% of their budgeted capital expenditure, 2012/13 to 2019/20
| Spent less than 80% of budget | Spent 80% to 100% of budget | Spent over 100% of budget | |
|---|---|---|---|
| 2012/13 | 46 | 22 | 10 |
| 2013/14 | 44 | 21 | 13 |
| 2014/15 | 46 | 21 | 11 |
| 2015/16 | 45 | 20 | 13 |
| 2016/17 | 47 | 19 | 12 |
| 2017/18 | 35 | 23 | 20 |
| 2018/19 | 40 | 20 | 18 |
| 2019/20 | 52 | 13 | 13 |
Source: Analysed from information collected from councils' annual reports.
2.28
Councils are currently preparing their 2021-31 LTPs. From our review of the LTP consultation documents, we observed that most councils are aware of delivery issues and have put plans in place to support the timing of their investments. However, there are risks that councils will not be able to deliver on their capital expenditure budgets because they will not be able to secure the necessary contractors, specialists, and associated resources.
2.29
This situation is likely compounded by border closures, which restricts the entry of people into New Zealand, and an increase in proposed capital projects, meaning that councils are competing with other entities (and each other) to secure limited resources. We intend to comment further on this issue when we report on the 2021-31 LTPs.
Building assets needed for growth
2.30
Some councils are experiencing significant population growth. For the purposes of our analysis, we have considered "high-growth councils" to be those categorised as such in the National Policy Statement on Urban Development Capacity 2016 (see Appendix 1).13
2.31
In their 2018-28 LTPs, high-growth councils forecast making significant investments to meet the additional demands on their infrastructure.
2.32
This is the second year we have examined how well high-growth councils have achieved their growth-related capital budgets. In 2019/20, we found that most of these councils did not build all the assets they had budgeted for. This was also the case in 2018/19. We encourage these councils to reassess their future planned budgets to accommodate what has not been achieved to date.
2.33
In 2019/20, high-growth councils spent approximately $1.04 billion (2018/19: $0.93 billion) on capital expenditure intended to meet additional demand. This was nearly 70% of the $1.49 billion budgeted in 2019/20 for this purpose. Three councils spent more than their growth-related capital expenditure budgets. In contrast, four councils spent less than 45% of their budgets.
2.34
High-growth councils received capital subsidies or grant revenue of $1.15 billion – 6.4% more than the $1.08 billion budgeted for the year. It is therefore unlikely that funding is the primary reason for the delay in capital expenditure. High-growth councils might not have been able to complete their capital programmes for the same reasons as other councils (see paragraphs 2.28-2.29).
2.35
As noted in paragraph 2.30, we have considered high-growth councils to be those categorised as such in the National Policy Statement on Urban Development Capacity 2016. However, from our review of the 2021-31 LTP consultation documents, we note that many councils that previously indicated they had negative or static growth are now having to deal with growth and the associated provision of infrastructure. Therefore, the definition and impacts of "high-growth" could apply to more councils in the future.
Council debt trends
2.36
The total amount of budgeted debt for all councils for the year ended 30 June 2020 was $19.52 billion. The actual total debt was $19.65 billion. This was $136 million, or 1%, more than budget. Councils generally use debt to fund capital expenditure.
2.37
We considered Auckland Council's debt separately from other councils because of its size. Auckland Council had borrowing of $10.2 billion as at 30 June 2020, which was $494 million more than they anticipated borrowing. Auckland Council reported in its annual report that the increase in borrowings was higher than budget due to the reduced revenues and pressures on working capital arising from Covid-19.14
2.38
The total amount of debt as at 30 June 2020 for all other councils was $9.44 billion, compared with a budget of $9.80 billion.
2.39
From our review of the 2021-31 LTP consultation documents, we are aware that several councils are planning to borrow to fund increased capital expenditure. In some cases, councils are planning to borrow to help fund operating costs in the short term, particularly where they have been affected by lower than anticipated revenue streams.
2.40
As a general principle, debt should not be used to fund operations. It has been described as "borrowing to pay for the groceries". Any councils borrowing to fund operating expenditure should consider their rationale for using this approach.
10: For 2019/20, draft financial information for five local authorities was included in our analysis because the audited financial information was not adopted at the time we carried out our analysis. Five councils missed the revised deadline to complete and adopt their audited annual report by 31 December 2020. Paragraphs 3.4-3.9 of this report provide more information.
11: For example, Office of the Auditor-General (2019), Our 2018 work on local government, Figure 2.
12: This information is from the statements of cash flows of councils. It includes only the cash that councils spent on purchasing property, plant, and equipment and intangible assets.
13: The National Policy Statement on Urban Development 2020 came into effect on 20 August 2020. It replaced the National Policy Statement on Urban Development Capacity 2016. The new policy statement might mean that different councils are defined as high growth from 2020/21 onwards. However, the old policy statement still applied for the 2019/20 year we are looking at in this report.
14: Auckland Council (2020), Auckland Council Annual Report 2019/20, Volume 3, page 65.

