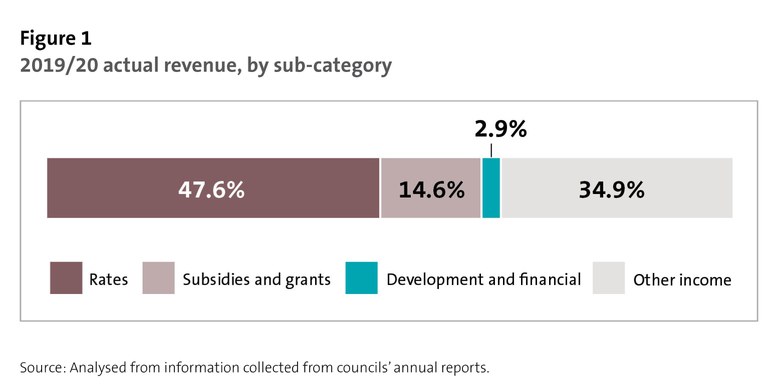
Figure 1 - 2019/20 actual revenue, by sub-category
This chart shows a bar divided into segments to show what percentage of the 2019/20 actual revenue each of four sub-categories accounted for. The first segment is the largest and shows that 47.6% of the 2019/20 actual revenue related to rates. The next segment is smaller and shows that 14.6% of revenue related to subsidies and grants. The smallest segment represents the 2.9% of revenue relating to development and financial contributions. The 34.9% in the final segment represents all other income.
https://www.oag.parliament.nz/2021/local-govt/media-kit/figure1.jpg/view
https://www.oag.parliament.nz/2021/local-govt/media-kit/figure1.jpg/@@download/image/figure1.jpg
Figure 1 - 2019/20 actual revenue, by sub-category
This chart shows a bar divided into segments to show what percentage of the 2019/20 actual revenue each of four sub-categories accounted for. The first segment is the largest and shows that 47.6% of the 2019/20 actual revenue related to rates. The next segment is smaller and shows that 14.6% of revenue related to subsidies and grants. The smallest segment represents the 2.9% of revenue relating to development and financial contributions. The 34.9% in the final segment represents all other income.


