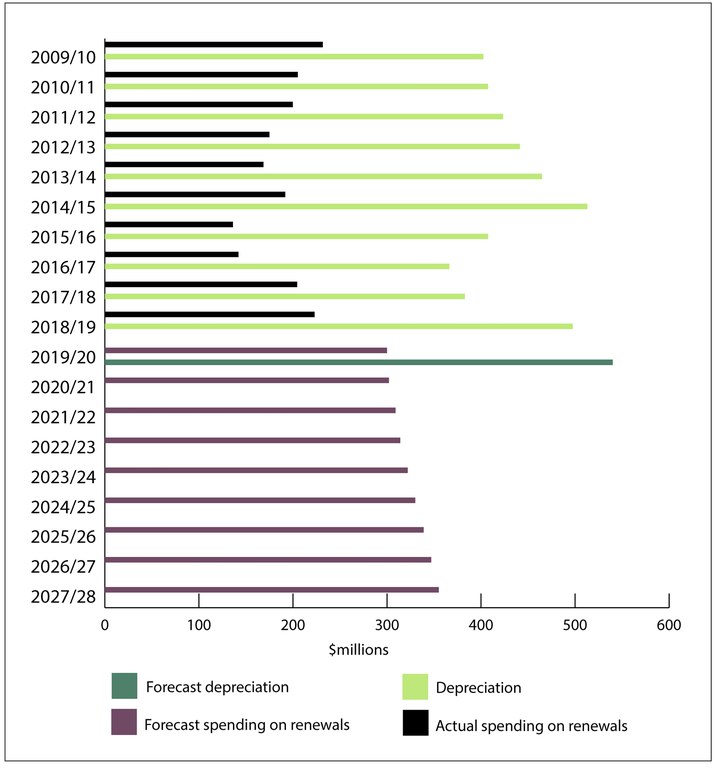
Figure 11 - Actual and estimated spending on renewals compared with depreciation, from 2009/10 to 2027/28
The bar chart shows the Agency has consistently spent less on renewing state highways than depreciation, and forecasts show this pattern is likely to continue.
https://www.oag.parliament.nz/2020/nzta-contracts/media-kit/figure-11.jpg/view
https://www.oag.parliament.nz/2020/nzta-contracts/media-kit/figure-11.jpg/@@download/image/Figure 11.jpg
Figure 11 - Actual and estimated spending on renewals compared with depreciation, from 2009/10 to 2027/28
The bar chart shows the Agency has consistently spent less on renewing state highways than depreciation, and forecasts show this pattern is likely to continue.


