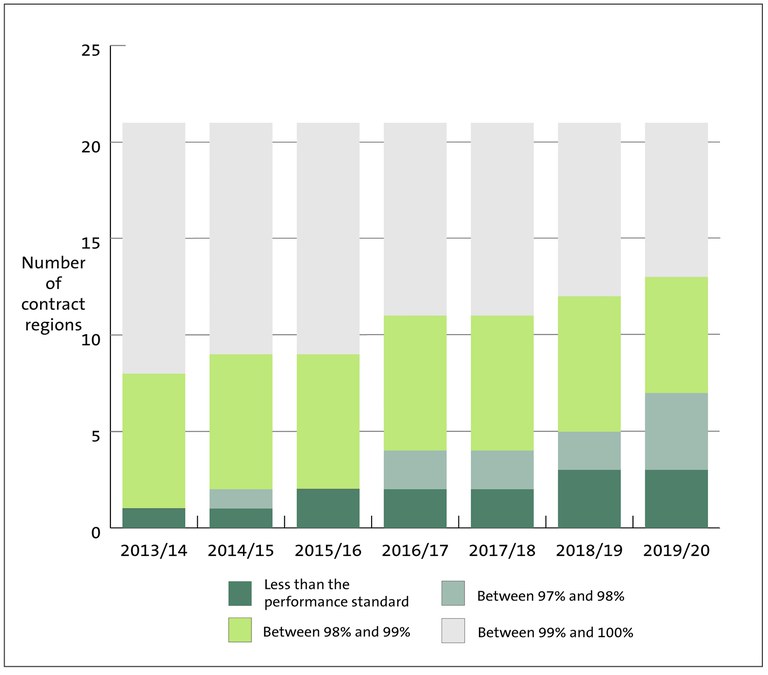
Figure 10 - Number of contract regions meeting the measure for percentage of travel on state highways classed as smooth, from 2013/14 to 2019/20
The bar chart shows a slow increase in the low number of contract regions where performance is not meeting the Agency’s performance standard of 97%.
https://www.oag.parliament.nz/2020/nzta-contracts/media-kit/figure-10.jpg/view
https://www.oag.parliament.nz/2020/nzta-contracts/media-kit/figure-10.jpg/@@download/image/Figure 10.jpg
Figure 10 - Number of contract regions meeting the measure for percentage of travel on state highways classed as smooth, from 2013/14 to 2019/20
The bar chart shows a slow increase in the low number of contract regions where performance is not meeting the Agency’s performance standard of 97%.


