Part 1: Introduction
1.1
The New Zealand Transport Agency (the Agency) is responsible for managing the state highway network (state highways). State highways play a vital role in linking our towns and communities, and vehicles travelled almost 24 billion kilometres on them in 2018/19. In 2018/19, they were valued at about $50 billion and were more than 11,000 kilometres long. Each year, the Agency spends more than
$500 million on maintaining them.
1.2
Effective and efficient maintenance keeps New Zealand’s state highways safe and reliable. If they are not effectively maintained, the road condition will deteriorate and state highways will become less safe.
1.3
Deterioration in the condition of the roads can increase fuel usage, vehicle maintenance costs, and travel times for everyone who uses those roads.
Why we carried out our audit
1.4
New Zealanders ought to be able to trust that the Agency is maintaining our state highways effectively and efficiently.
1.5
In 2010 and 2011, we carried out two performance audits assessing how effectively the Agency planned and delivered the maintenance and renewals of state highways. We made 15 recommendations to the Agency.1
1.6
In 2014, we carried out a follow-up audit to look at how the Agency responded to the findings and main recommendations from the two earlier audits. We found that the Agency had made some changes, including introducing the Network Outcomes Contract model. It was in the process of further improving the quality and completeness of its asset information.2
1.7
As a result of our follow-up work, we suggested that the Agency ensure that the Network Outcomes Contract model delivered the intended financial and customer benefits, without a detrimental effect on the market, by:
- monitoring the contracts for their effect on market behaviour and pricing and the benefits they deliver, and adjusting the procurement process if necessary;
- establishing robust baseline information, so that meaningful cost comparisons can be made; and
- ensuring that performance monitoring of the contracts happens in practice, by consistently and accurately reporting the results of performance monitoring of the contracts to suppliers, and enforcing any performance improvements.
1.8
Network Outcomes Contracts currently cover more than 90% of the roads making up the state highway network by length (the rest of the network is maintained through alliance contracts).3 For simplicity, we use “contracts” throughout this report when referring to Network Outcomes Contracts. When we refer to the people involved in each contract, we use “contract team”. Some suppliers have multiple contracts, and each of these contracts has its own contract team.
1.9
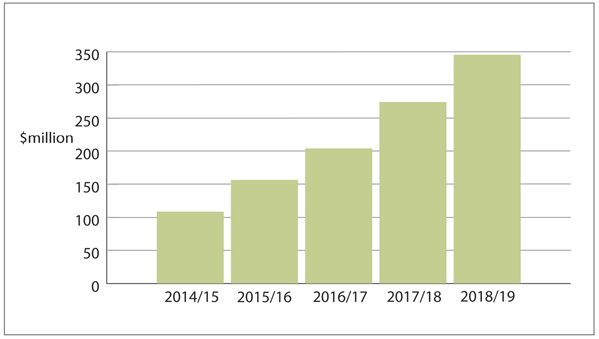
For each of the last five years, as the Agency set up more contracts, it increased spending through the contracts from $109 million to $346 million (see Figure 1).
Figure 1
Spending on the maintenance of state highways through Network Outcomes Contracts
The bar chart shows a steady increase in spending each year for the last five years, to $346 million.

Source: Office of the Auditor-General, using data from the New Zealand Transport Agency.
1.10
We wanted to assess how effectively and efficiently the Agency maintains state highways through the contracts. As part of this, we also wanted to assess how the Agency had managed the risk to market competition that we identified in our 2014 follow-up audit.
What are Network Outcomes Contracts?
1.11
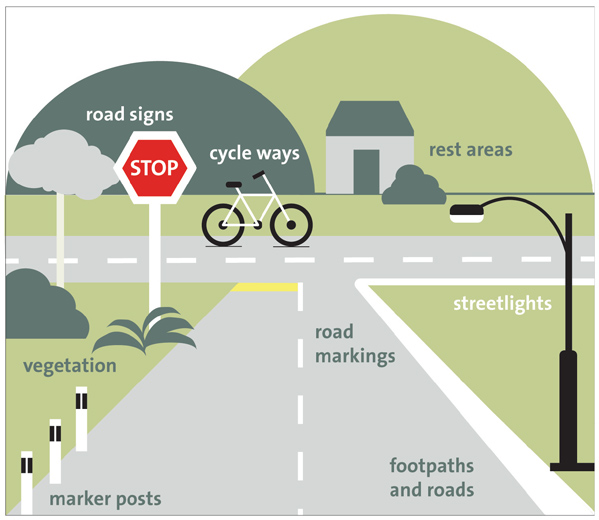
The contracts are between the Agency and a primary supplier to provide all network management and maintenance activities for state highways, such as maintenance for pavements, signs, and streetlights (see Figure 2). The Agency expects suppliers to take a stewardship role in maintaining the network. That means taking ownership for and pride in the services delivered and quality of work done. Some contracts also include council-owned roads that are not part of the state highway network.
Figure 2
What the Network Outcomes Contracts cover
The picture shows that, as well as the road, the contracts include rest areas, cycleways, road signs and markings, streetlights, marker posts, and adjacent footpaths.

Source: Office of the Auditor-General.
1.12
The Agency set out the benefits from introducing the Network Outcomes Contract model in a July 2012 consultation document.4 The Agency expected the contracts to increase effectiveness and efficiency, and reduce costs.
1.13
In particular, the Agency assumed that longer-term contracts would save money through economies of scale and scope. For suppliers, longer-term contracts would reduce the administrative costs of re-tendering after shorter terms and give them increased certainty.
1.14
The Agency also assumed that it would be more efficient to have fewer contracts, covering 21 of 23 regions,5 with standardised terms. This was expected to significantly reduce administrative and tendering costs, enable it to use resources optimally, and support enhanced capability-building throughout the industry by more strategically allocating people and expertise.
1.15
The Agency also assumed that all-inclusive contracts (using two fee components, “lump sum” and “measure and value”) would encourage greater accountability by suppliers for the overall performance of the network. As well as providing financial savings from improving the co-ordination of works on any specific road, this could improve road users’ experience.
1.16
Other potential benefits included a consistent performance framework, with performance incentives to encourage suppliers to achieve the desired outcomes. Enhanced data reporting was expected to help the Agency better monitor the outcomes achieved.
1.17
The Agency also expected to have greater influence over the timing and type of some works.
1.18
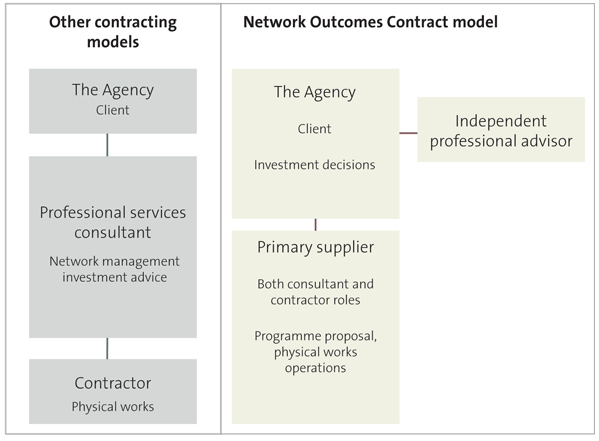
The Agency previously used other contracting models to maintain state highways. They typically involved a contract between the Agency and a consultant, and another contract between the Agency and a contractor. The consultant was responsible for asset management and for managing the contractor.
1.19
The Network Outcomes Contract model emphasises a strong collaborative and partnering relationship between the Agency and suppliers to achieve the contract outcomes. The Agency and suppliers engaging with each other constructively significantly influences the success of the contract because the parties depend on each other. Figure 3 shows the main relationship differences between other previous contracting models and the Network Outcomes Contract model.
Figure 3
Other contracting models compared with the Network Outcomes Contract model
Other contracting models have a consultant between the Agency and the contractor; Network Outcomes Contracts do not.

Source: Office of the Auditor-General.
What we looked at
1.20
We audited how effectively and efficiently the Agency is using the contracts to maintain state highways. We looked at how the Agency:
- manages risks and opportunities associated with the contracts to achieve desired outcomes, including whether the roads are well maintained;
- manages the contracts with suppliers; and
- identifies, shares, and applies lessons from the contracts.
1.21
We did not audit:
- the tender process for awarding the contracts to suppliers;
- the completeness and quality of the asset information; or
- the Agency’s maintenance of state highways not covered by a contract.
1.22
Our report focuses on the performance of the Agency because it is responsible for maintaining state highways. We did not audit or comment on the performance of the suppliers, other than in the context of the Agency managing suppliers’ performance under the contracts.
How we carried out our audit
1.23
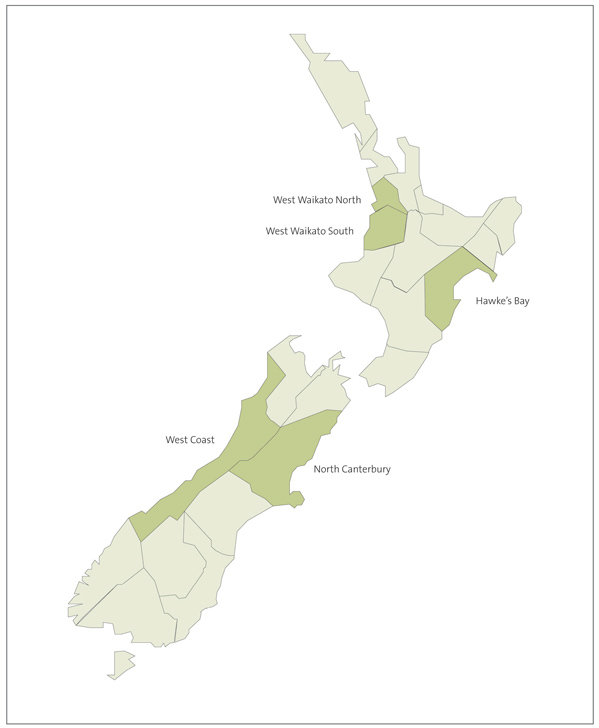
We looked at five contracts to assess how effectively Agency staff are managing the individual contracts, and the differences in performance. The five contracts we looked at in detail were Hawke’s Bay, North Canterbury, West Coast, West Waikato North, and West Waikato South (see Figure 4). This selection was based on network size, performance (including high and low performers based on the Agency’s data), the value of the contract, and having a range of suppliers in our sample.
Figure 4
Contracts we looked at
The map of New Zealand shows the five regions of West Waikato North, West Waikato South, Hawke’s Bay, West Coast, and North Canterbury.

Source: Office of the Auditor-General.
1.24
We analysed spending on the maintenance of state highways, other financial data, and a range of performance data, including relationship survey results and road condition data.
1.25
We analysed documents from the Agency, suppliers, and other relevant organisations. The documents included information on expected benefits, risk management, contract management, monitoring and reporting of performance, governance of contracts, internal audit reviews, and information about applying lessons.
1.26
We interviewed more than 50 staff from the Agency, suppliers, and subcontractors to check and clarify our understanding of the documents and to supplement the documentary and data evidence. To get a regional perspective, we interviewed staff from the Agency, suppliers, and subcontractors who are directly involved in each of the five contract regions.
1.27
We also interviewed members and staff from industry bodies, road user groups, local government, and other relevant organisations to understand how the change in contracting model had affected them.
Structure of this report
1.28
In Part 2, we discuss the Agency’s and the contract teams’ performance in maintaining state highways and whether the Agency has achieved the benefits it expected from the contracts.
1.29
In Part 3, we discuss the Agency’s management of strategic risks, and in Part 4, we discuss the collaborative intent of the contracts.
1.30
In Part 5, we discuss how the Agency identifies, shares, and applies lessons. We also discuss the latest round of contracts.
1.31
The Appendix sets out the main groups involved in the contracts and the relationships between them.
1: Our recommendations were about improving the quality and completeness of its asset information, improving its planning for maintenance and renewal work, designing and selecting service delivery models, and maintaining relationships and monitoring contracts. For more information, see our reports New Zealand Transport Agency: Information and planning for maintaining and renewing the state highway network (September 2010) and New Zealand Transport Agency: Delivering maintenance and renewal work on the state highway network (September 2011). Both reports are available on our website, www.oag.parliament.nz.
2: New Zealand Transport Agency: Maintaining and renewing the state highway network – follow-up report (October 2014). This report is available on our website, www.oag.parliament.nz.
3: There are 21 contracts. However, the performance of one contract is not currently assessed. In addition to the 21 Network Outcomes Contracts, the Agency also uses two alliance contracts. One is for maintaining the state highways in Auckland, and the other to do emergency and minor maintenance works on the Milford Road. This is to account for the exceptional circumstances relating to these two, such as the volume of traffic in Auckland. An alliance is a shared risk delivery model involving contractors, consultants, and the Agency working together to operate and maintain state highways.
4: New Zealand Transport Agency, State Highway Maintenance and Operations Review consultation document, July 2012.
5: Of the 23 regions, 21 are covered by contracts and two (Auckland System Management and Milford Road) are alliances. There were previously 37 contract regions.

