Balanced reporting on what went well and what didn't
Our general observations
From the 40 annual reports we looked at, not many gave appropriate prominence to what didn't go well in addition to what did. Public organisations that were transparent and open about what didn’t go well, and presented this information in a prominent way in their annual report, significantly affected how much we trusted the broader information in the annual report.
New Zealand Customs Service
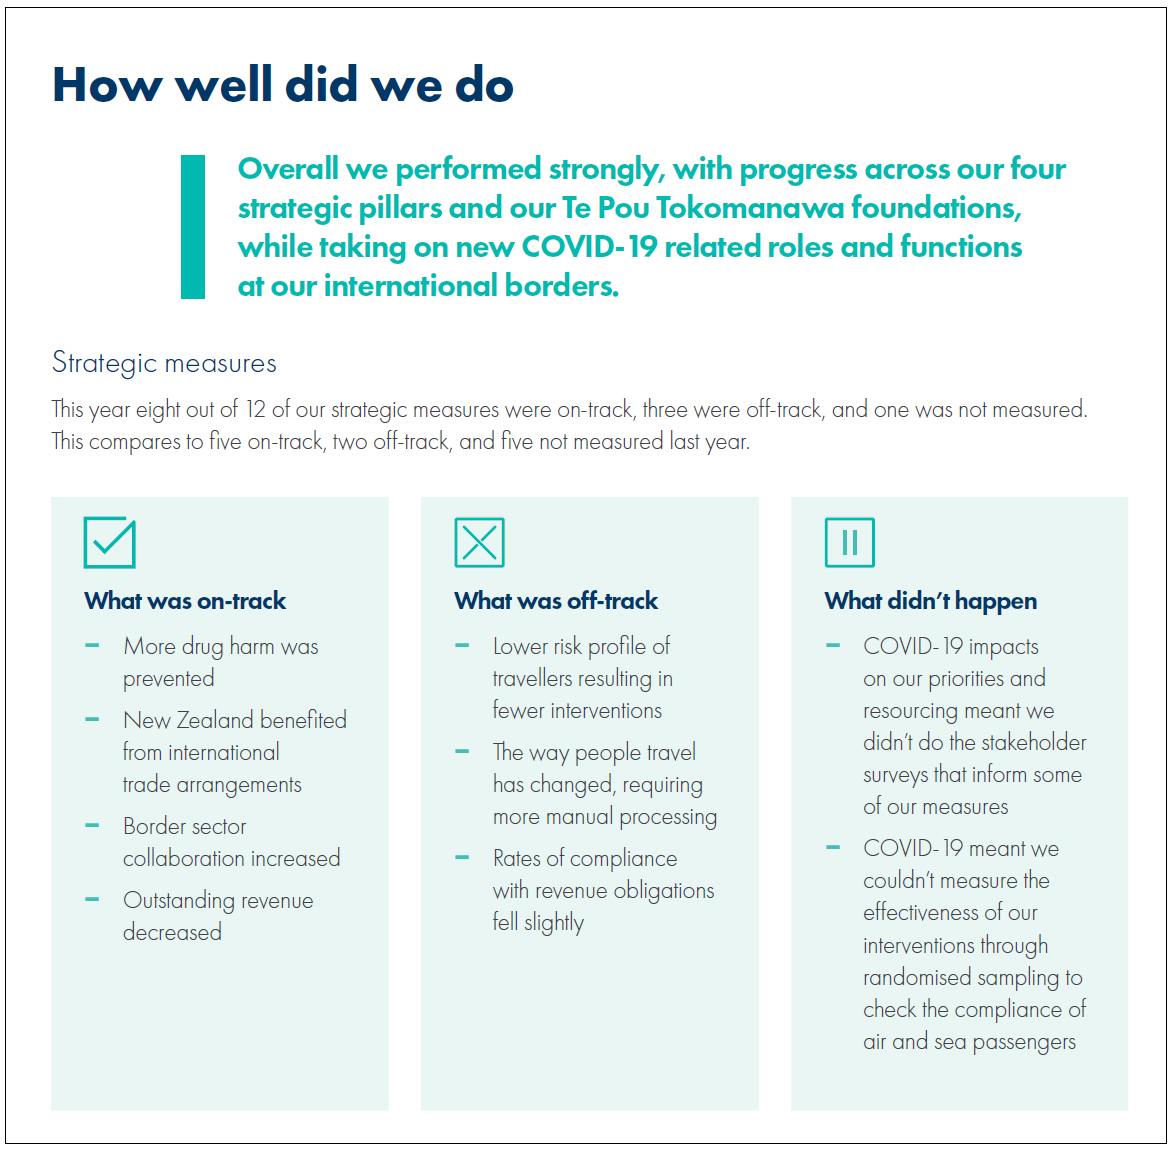
New Zealand Customs Service's 2020/21 Annual Report is open, honest, and transparent about “what went well” and “what didn’t”. This can significantly increase users’ trust in the report and in the public organisation.
What we liked:
- Open, honest, and transparent reporting on “what was on-track”, “what was off-track”, and “what didn’t happen”.
- The "How well did we do" information is presented early and prominently in the annual report.
- Simple, clear summary of the overall performance followed by more detailed performance reporting.

Inland Revenue Department
Inland Revenue Department’s 2020/21 Annual Report is open and transparent about when performance issues have arisen. Being open and honest about issues in performance, alongside a focus on improvement, can significantly increase trust in the report and the public organisation.
What we liked:
-
Open, honest, and transparent reporting on issues and concerns that arose in its service delivery and performance.
-
Reporting shows a clear focus on learning by identifying where issues and concerns are arising and focusing on improvement.
A significant number of people received an extra pay this year, leading to extra tax and causing confusion for some…Some of our letters requiring more information from customers also caused confusion…We continue to learn from each year and focus on how to make the next process run as smoothly as possible (see page 31 of the annual report).
We did face some issues, which we’re working to prevent from happening again. For example, entitlements for some customers were estimated incorrectly because they’d had multiple employers and the employer had not provided key information to us. We’ve been updating customer accounts, encouraging people to do this themselves online and focusing on improvements to our processes (see page 32 of the annual report).
Accident Compensation Corporation
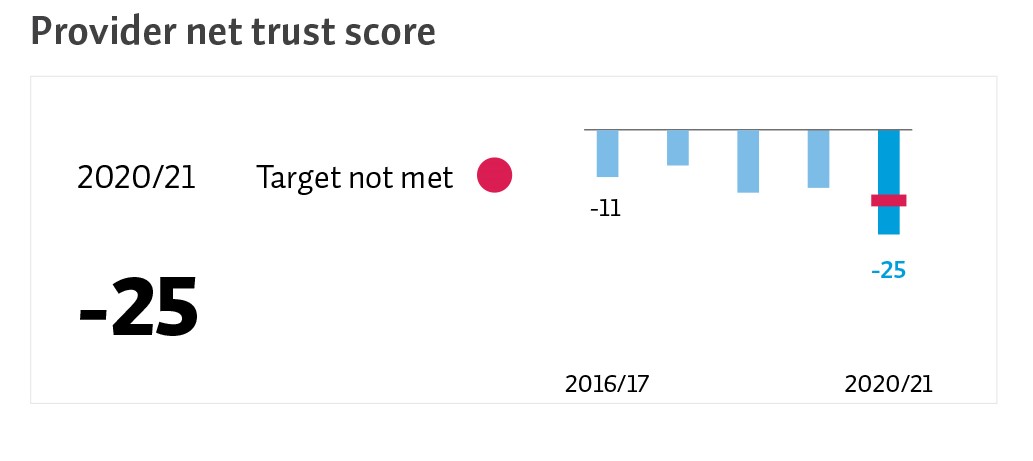
Accident Compensation Corporation’s 2020/21 Annual Report includes open and clear reporting about where it is not achieving performance objectives, with comments on how it intends to improve. This demonstrates the key values and behaviours that are important to longer-term performance improvement.
What we liked:
- Transparently shows a worsening result within the context of sufficient trend information (at least three years).
- Reports the lower results for two of the provider groups in the commentary.
- Focused on the future, with comments on initiatives to address this.


