Appendix 6. Regional councils' forecast financial results
This Appendix provides a summary of regional councils' LTP financial forecasts.77 Regional councils do not include unitary authorities, which for the purposes of our analysis we have grouped in their respective provincial or rural sub-sectors. The data presented below is based on our own analysis and represents averages of data across councils in this sub-sector, unless otherwise stated.
In this Appendix, we have combined and presented financial information prepared by the regional councils. We do not have a view on the merits of these councils' financial forecasts, other than what we express in the main body of this report.
6.1
Operating revenue for regional councils, as forecast in the 2015-25 and 2018-28 long-term plans
In regional councils' 2018-28 LTPs, the forecast operating revenue is 19% more than what was forecast for 2015-25.
| Revenue | 2015-25 LTP $billion | 2018-28 LTP $billion | % increase |
|---|---|---|---|
| Rates revenue | 5.2 | 6.4 | 25 |
| Subsidies and grants revenue | 1.6 | 2.0 | 25 |
| Other revenue | 4.0 | 4.4 | 10 |
| Total | 10.7 | 12.8 | 19 |
Regional councils receive 34% of their total forecast revenue from "other revenue" (such as grants and subsidies, or dividends from investments), which is proportionately more than the other sub-sectors (other than Auckland Council).
6.2
Rates revenue of regional councils, as forecast in the 2015-25 and 2018-28 long-term plans
Regional councils' rates revenue is forecast to increase 41% ($0.5 billion to $0.7 billion) across the 2018-28 LTPs.
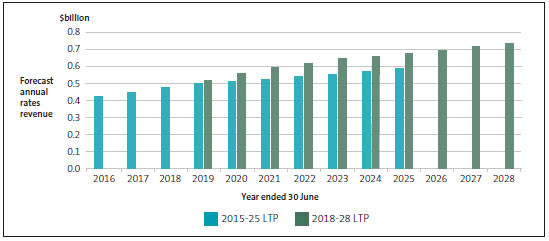
Regional councils' forecast rates revenue as a proportion of total revenue ranges from 35% for Taranaki Regional Council to 72% for Horizons Regional Council. Dividend revenue from subsidiaries is a significant revenue source for some regional councils such as Taranaki Regional Council.
6.3
Operating expenditure of regional councils, as forecast in the 2015-25 and 2018-28 long-term plans
Operating expenditure forecast in the regional councils' 2018-28 LTPs is 18% more than what was forecast for 2015-25.
| Operating expenditure | 2015-25 LTP $billion | 2018-28 LTP $billion |
% increase |
|---|---|---|---|
| Employee costs | 2.4 | 3.0 | 27 |
| Interest expense | 0.4 | 0.5 | 33 |
| Depreciation and amortisation | 0.6 | 0.8 | 43 |
| Other operating expenses | 7.1 | 8.0 | 12 |
| Total | 10.4 | 12.3 | 18 |
Increases in forecast operating expenditure compared with the 2015-25 LTP forecasts range from 7% for Environment Canterbury to 56% for Otago Regional Council.
6.4
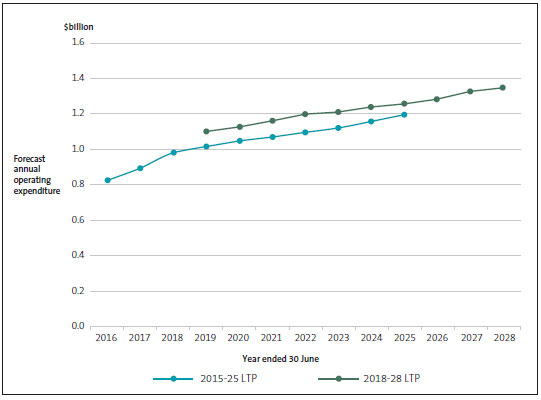
Total operating expenditure of regional councils by year, as forecast in the 2015-25 and 2018-28 long-term plans
In the regional councils' 2018-28 LTPs, operating expenditure is forecast to be more than for each comparable year of the 2015-25 LTPs.
6.5
Regional councils' forecast spending on capital in the 2015-25 and 2018-28 long-term plans
Capital expenditure for regional councils is forecast to increase by 38% for 2018-28 compared with the forecast for 2015-25.
| Capital expenditure | 2015-25 LTP $billion | 2018-28 LTP $billion | % increase |
|---|---|---|---|
| Meet additional demand | 0.0 | 0.1 | 243 |
| Improve the level of service | 0.6 | 0.7 | 14 |
| Renew existing assets | 0.5 | 0.7 | 57 |
| Total | 1.1 | 1.5 | 38 |
Greater Wellington Regional Council is forecasting about 50% of all regional councils' capital expenditure. This is primarily on public passenger transport and bulk water assets, reflecting its particular range of responsibilities and significant scale compared to other regional councils.
6.6
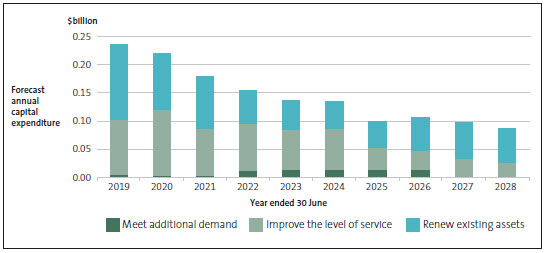
What regional councils plan to spend on capital by year, according to the 2018-28 long-term plans
Capital expenditure for regional councils is forecast to decline steadily during the 2018-28 period.
6.7
Total debt by year, as forecast in regional councils' 2015-25 and 2018-28 long-term plans
In the regional councils' 2018-28 LTPs, debt is forecast to increase from $0.7 billion to $1.1 billion from 2018/19 to 2027/28. This is an increase of 56%.
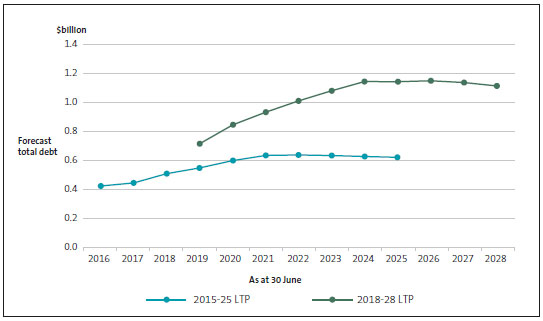
Four regional councils are forecasting to have no external debt by 2027/28.
6.8
Total debt as a percentage of revenue, by year, as forecast in regional councils' 2015-25 and 2018-28 long-term plans
Regional councils' debt burden is forecast to be greater in the 2018-28 LTP forecasts compared with the 2015-25 LTP forecasts, but remains low compared with the sector as a whole.
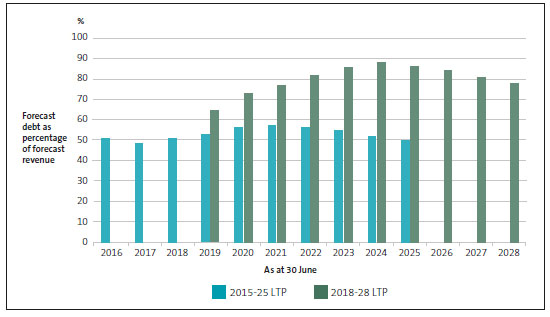
When excluding regional councils that are forecast in the 2018-28 LTPs to not borrow externally, the percentage of forecast debt to revenue remains below 100% over the 10-year period.
77: Our analysis excludes West Coast Regional Council because its LTP was not available when this report was written.

