Appendix 3: Auckland Council's forecast financial results
This Appendix provides a summary of Auckland Council's group LTP financial forecasts. The data presented below is based on our own analysis of Auckland Council's group LTP, unless otherwise stated.
In this Appendix, we have combined and presented financial information prepared by Auckland Council. We do not have a view on the merits of its financial forecasts other than what we express in the main body of this report.
3.1
Operating revenue for Auckland Council, as forecast in its 2015-25 and 2018-28 long-term plans
In Auckland Council's 2018-28 LTP, the forecast operating revenue is 25% more than what was forecast for 2015-25.
| Revenue | 2015-25 LTP $billion |
2018-28 LTP $billion |
% increase |
|---|---|---|---|
| Rates revenue | 19.3 | 22.5 | 17 |
| Subsidies and grants revenue | 5.8 | 8.4 | 44 |
| Other revenue | 17.5 | 21.4 | 22 |
| Development and financial contributions | 2.4 | 2.9 | 21 |
| Vested assets (non-cash revenue) | 1.9 | 3.3 | 76 |
| Total | 46.9 | 58.5 | 25 |
Auckland Council's forecast rates revenue is its largest revenue source, at 38% of forecast total revenue in its 2018-28 LTP. This is less than other sub-sectors, because Auckland Council produces a group LTP in which the revenue for subsidiaries does not include rates revenue. All other councils prepared an LTP that included council-only financial forecasts.
3.2
Auckland Council's rates revenue forecasts in its 2015-25 and 2018-28 long-term plans
Auckland Council's forecast rates revenue for 2018-28 is similar to what it forecast in its 2015-25 LTP for the years in common.
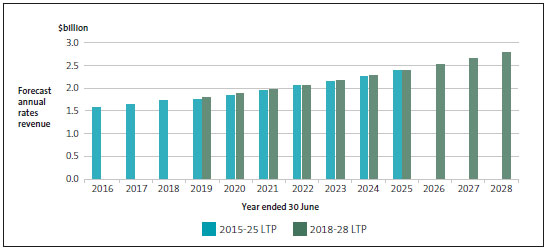
Note: The forecast rates revenue does not include the revenue Auckland Council forecast to receive from the Auckland regional fuel tax. The forecast revenue from this source is included in "other revenue".
Auckland Council's rates revenue is forecast to increase by 55% ($1.8 billion to $2.8 billion) during the period of the 2018-28 LTP.
3.3
Forecast operating expenditure, according to Auckland Council's 2015-25 and 2018-28 long-term plans
The operating expenditure that Auckland Council expects to pay across 2018-28 is 16% more than what was forecast for 2015-25.
| Operating expenditure | 2015-25 LTP $billion |
2018-28 LTP $billion |
% increase |
|---|---|---|---|
| Employee costs | 8.3 | 10.1 | 22 |
| Interest expense | 5.6 | 6.1 | 8 |
| Depreciation and amortisation | 10.1 | 12.2 | 21 |
| Other operating expenses | 17.4 | 19.6 | 12 |
| Total | 41.4 | 47.9 | 16 |
3.4
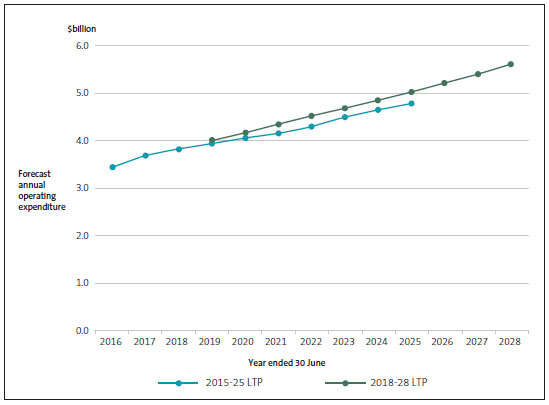
Auckland Council's total operating expenditure, as forecast in its 2015-25 and 2018-28 long-term plans
In its 2018-28 LTP forecast, Auckland Council expects to pay more on operating expenditure than it had forecast for each comparable year of the 2015-25 LTP.
3.5
Auckland Council's forecast spending on capital in its 2015-25 and 2018-28 long-term plans
Overall, Auckland Council's capital expenditure is forecast to increase by 29% for 2018-28 compared with the forecast for 2015-25. The largest percentage increase in forecast capital expenditure is to meet additional demand in the city.
| Capital expenditure | 2015-25 LTP $billion | 2018-28 LTP $billion | % increase |
|---|---|---|---|
| Meet additional demand | 5.1 | 7.2 | 41 |
| Improve the level of service | 6.8 | 8.7 | 29 |
| Renew existing assets | 6.8 | 8.1 | 19 |
| Total | 18.7 | 24.0 | 29 |
3.6
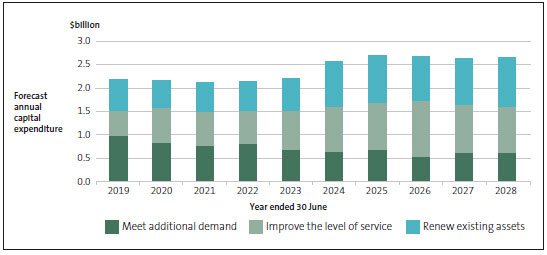
What Auckland Council plans to spend on capital by year according to its 2018-28 long-term plan
During the 10 years, Auckland Council's focus is expected to progressively change from meeting additional demand to improving service levels and renewing assets.
3.7
Total debt by year, as forecast in Auckland Council's 2015-25 and 2018-28 long-term plans
Auckland Council's debt is forecast to increase from $9.2 billion to $13.1 billion from 2018/19 to 2027/28. This is an increase of 42%.
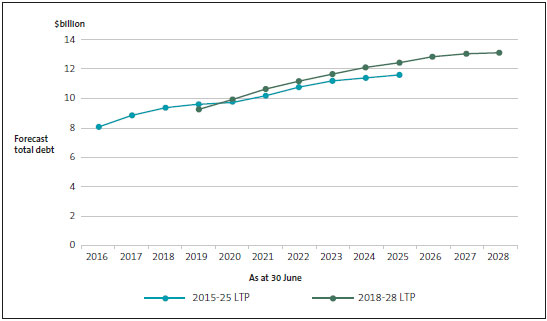
Auckland Council's debt remains more than 50% of the total local government sector debt.
3.8
Total debt as a percentage of total revenue, by year, as forecast in Auckland Council's 2015-25 and 2018-28 long-term plans
This graph shows Auckland Council's debt as a percentage of all of the Council's forecast revenue streams.
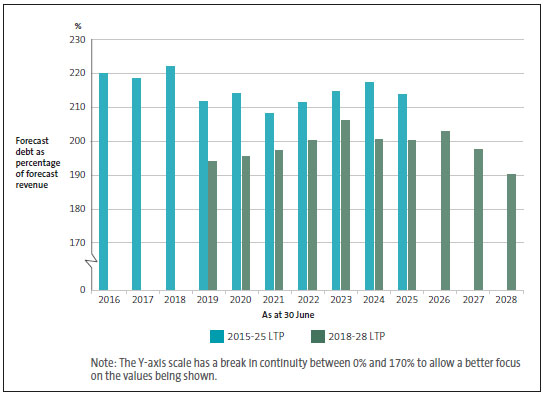
The above graph shows Auckland Council's debt as a percentage of all of the Council's forecast revenue streams. However, a significant portion of Auckland Council's revenue cannot be used to service its debt, as the Council has received it to fund capital expenditure (for example, development contributions), or the revenue is non-cash (vested asset revenue). Auckland Council also makes adjustments to its debt (for example, treating operating lease commitments as debt) when calculating its debt-to-revenue ratio.
When making these adjustments, Auckland Council's debt as a proportion of revenue in its 2018-28 LTP forecasts is more than the 2015-25 forecasts from 2019/20 onwards. Its debt as a proportion of revenue reaches 264% in 2020/21, and remains at that level until 2023/24, before reducing to 243% in 2027/28. Auckland Council has a debt limit of 270%.

