Appendix 4: Where patients were treated, from 2005/06 to 2009/10
Patients are not always treated by their own DHB. Each DHB:
- treats its own patients where feasible;
- refers its patients to be treated by another DHB; and
- treats patients who are the responsibility of other DHBs.
We have graphed the number of patients discharged in each category for each DHB from 2005/06 to 2009/10. We comment on some of the graphs, but not all of them.
The data includes day-case surgical patients if they were assigned a case weight, and surgical patients treated by private providers contracted to provide the surgery on the DHB's behalf.
The data reported does not include:
- scheduled medical patients;
- scheduled surgical patients from overseas who were treated by DHBs; and
- scheduled surgical patients treated by non-DHB providers. These patients were treated by a charity hospital or independently sought and paid for treatment in a private hospital.
Auckland DHB
Publicly funded scheduled surgical patients treated by Auckland DHB and publicly funded scheduled surgical patients from Auckland DHB treated by other DHBs, from 2005/06 to 2009/10
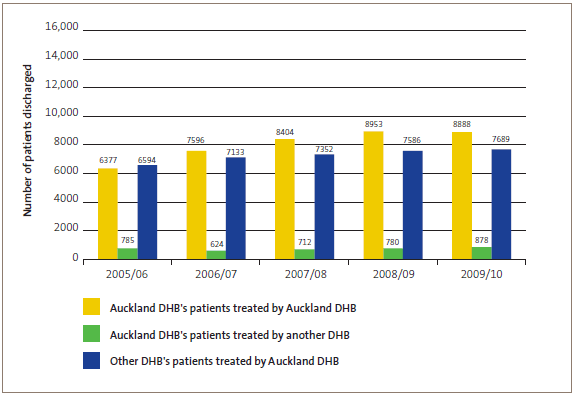
Data extracted from the National Minimum Data Set on 16 August 2010.
| During these five years, the proportion of its own patients treated by Auckland DHB increased from 49% to 54%. | |
In 2009/10, of Auckland DHB's patients who were treated by another DHB:
|
|
In 2009/10, of all the patients from other DHBs who Auckland DHB treated:
|
Bay of Plenty DHB
Publicly funded scheduled surgical patients treated by Bay of Plenty DHB and publicly funded scheduled surgical patients from Bay of Plenty DHB treated by other DHBs, from 2005/06 to 2009/10
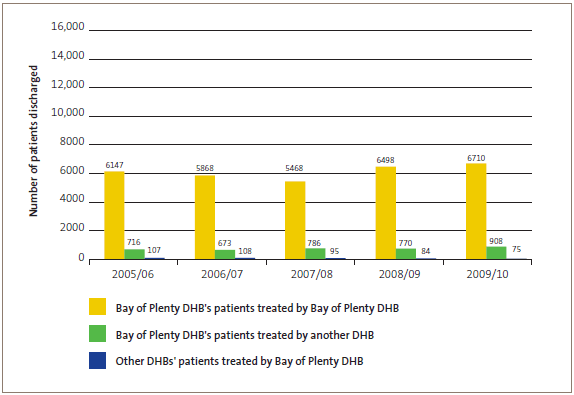
Data extracted from the National Minimum Data Set on 16 August 2010.
In 2009/10, of all Bay of Plenty DHB's patients who were treated by another DHB:
|
Canterbury DHB
Publicly funded scheduled surgical patients treated by Canterbury DHB and publicly funded scheduled surgical patients from Canterbury DHB treated by other DHBs, from 2005/06 to 2009/10
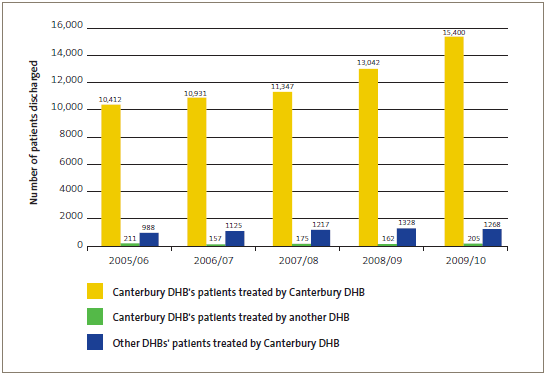
Data extracted from the National Minimum Data Set on 16 August 2010.
| During these five years, the number of its own patients who Canterbury DHB treated increased by 48%. | |
| In 2009/10, of all the other DHBs' patients who Canterbury DHB treated, 98% were from other South Island DHBs. |
Capital and Coast DHB
Publicly funded scheduled surgical patients treated by Capital and Coast DHB and publicly funded scheduled surgical patients from Capital and Coast DHB treated by other DHBs, from 2005/06 to 2009/10
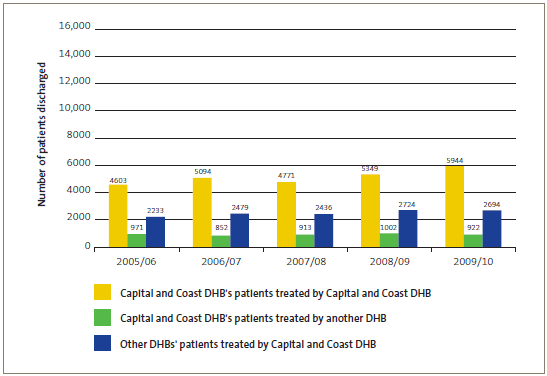
Data extracted from the National Minimum Data Set on 16 August 2010.
| In 2009/10, of all Capital and Coast DHB's patients who were treated by another DHB, Hutt Valley DHB treated 94%. | |
In 2009/10, 31% of the patients who Capital and Coast DHB treated came from other DHBs. Of this group:
|
Counties Manukau DHB
Publicly funded scheduled surgical patients treated by Counties Manukau DHB and publicly funded scheduled surgical patients from Counties Manukau DHB treated by other DHBs, from 2005/06 to 2009/10
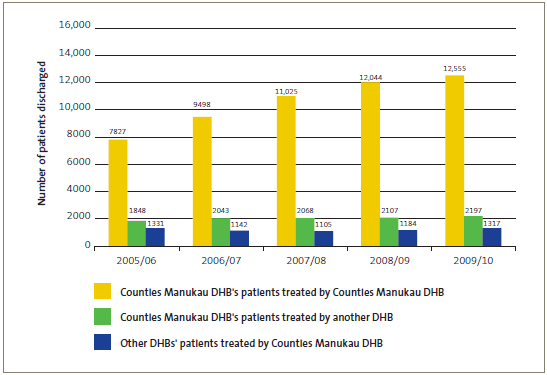
Data extracted from the National Minimum Data Set on 16 August 2010.
| During these five years, the number of its own patients who Counties Manukau DHB treated increased by 60%. | |
| In 2009/10, of all Counties Manukau DHB's patients who were treated by another DHB, Auckland DHB treated 96%. |
Hawke's Bay DHB
Publicly funded scheduled surgical patients treated by Hawke's Bay DHB and publicly funded scheduled surgical patients from Hawke's Bay DHB treated by other DHBs, from 2005/06 to 2009/10
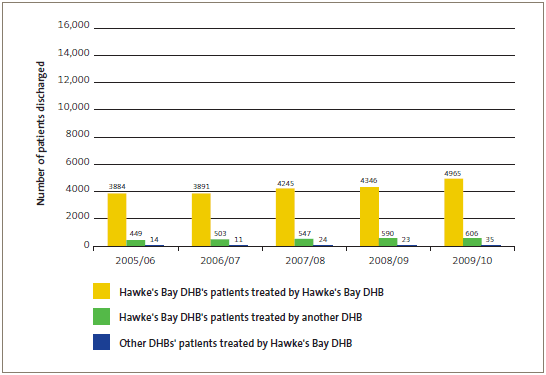
Data extracted from the National Minimum Data Set on 16 August 2010.
In 2009/10, of all Hawke's Bay DHB's patients who were treated by another DHB:
|
Hutt Valley DHB
Publicly funded scheduled surgical patients treated by Hutt Valley DHB and publicly funded scheduled surgical patients from Hutt Valley DHB treated by other DHBs, from 2005/06 to 2009/10
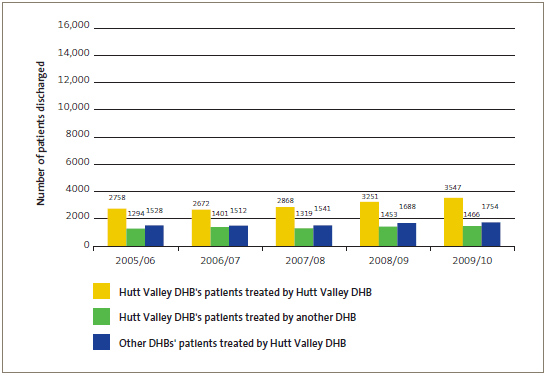
Data extracted from the National Minimum Data Set on 16 August 2010.
| During these five years, the number of its own patients who Hutt Valley DHB treated increased by 29%. | ||
| In 2009/10, 29% of Hutt Valley DHB's patients were treated by another DHB. Of this group, Capital and Coast DHB treated 98%. | ||
| During these five years, the number of other DHBs' patients who Hutt Valley DHB treated increased by 15%. In 2009/10, 33% of patients treated by Hutt Valley DHB were from other DHBs. Of this group:
|
||
Lakes DHB
Publicly funded scheduled surgical patients treated by Lakes DHB and publicly funded scheduled surgical patients from Lakes DHB treated by other DHBs, from 2005/06 to 2009/10
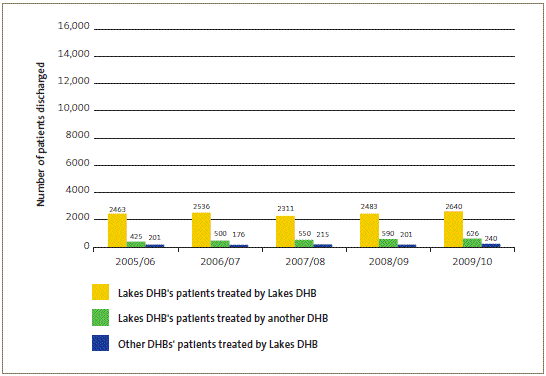
Data extracted from the National Minimum Data Set on 16 August 2010.
| During these five years, the number of its own patients who Lakes DHB treated remained stable. | |
During these five years, the number of Lakes DHB's patients who were treated by other DHBs increased by 47%:
|
|
| In 2009/10, of all the other patients who Lakes DHB treated, 86% were from Bay of Plenty DHB. |
MidCentral DHB
Publicly funded scheduled surgical patients treated by MidCentral DHB and publicly funded scheduled surgical patients from MidCentral DHB treated by other DHBs, from 2005/06 to 2009/10
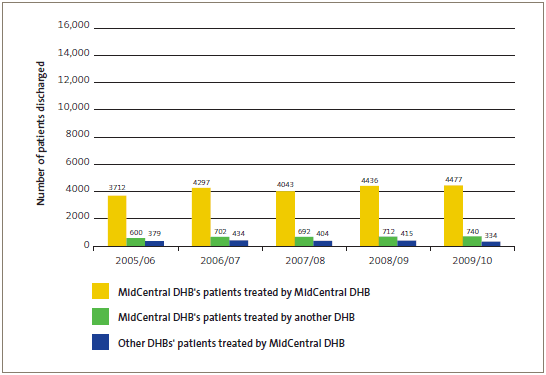
Data extracted from the National Minimum Data Set on 16 August 2010.
In 2009/10, 14% of MidCentral DHB's patients were treated by another DHB. Of this grou:
|
Nelson Marlborough DHB
Publicly funded scheduled surgical patients treated by Nelson Marlborough DHB and publicly funded scheduled surgical patients from Nelson Marlborough DHB treated by other DHBs, from 2005/06 to 2009/10
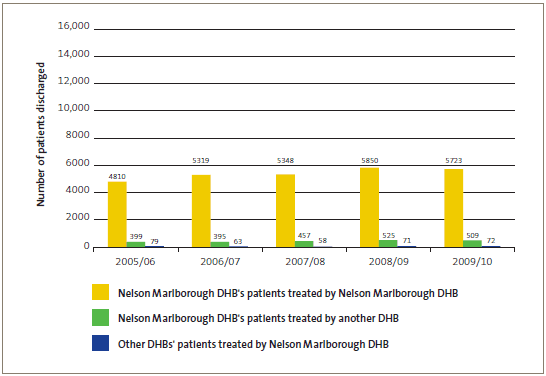
Data extracted from the National Minimum Data Set on 16 August 2010.
In 2009/10, 8% of Nelson Marlborough DHB's patients were treated by another DHB. Of this group:
|
Northland DHB
Publicly funded scheduled surgical patients treated by Northland DHB and publicly funded scheduled surgical patients from Northland DHB treated by other DHBs, from 2005/06 to 2009/10
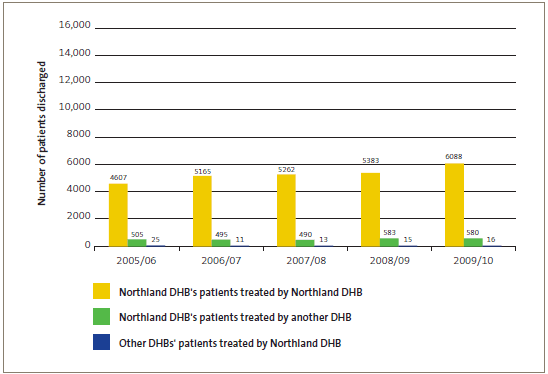
Data extracted from the National Minimum Data Set on 16 August 2010.
| In 2009/10, of all Northland DHB's patients who were treated by another DHB, Auckland DHB treated 87%. |
Otago DHB (now part of Southern DHB)
Publicly funded scheduled surgical patients treated by Otago DHB and publicly funded scheduled surgical patients from Otago DHB treated by other DHBs, from 2005/06 to 2009/10
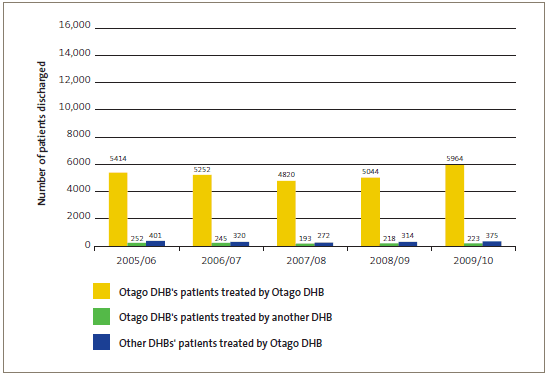
Data extracted from the National Minimum Data Set on 16 August 2010.
| The number of its own patients who Otago DHB treated decreased in the years up to 2007/08 and then increased. The same pattern occurred with the other groups of patients. |
South Canterbury DHB
Publicly funded scheduled surgical patients treated by South Canterbury DHB and publicly funded scheduled surgical patients from South Canterbury DHB treated by other DHBs, from 2005/06 to 2009/10
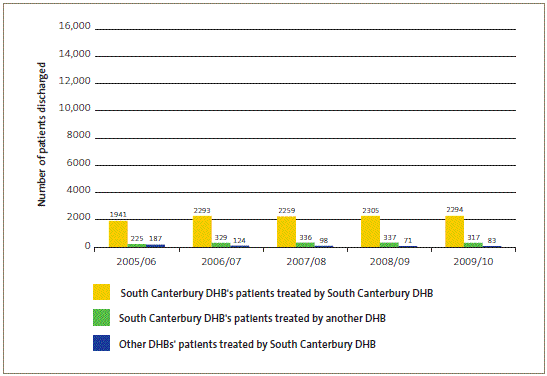
Data extracted from the National Minimum Data Set on 16 August 2010.
Southland DHB (now part of Southern DHB)
Publicly funded scheduled surgical patients treated by Southland DHB and publicly funded scheduled surgical patients from Southland DHB treated by other DHBs, from 2005/06 to 2009/10
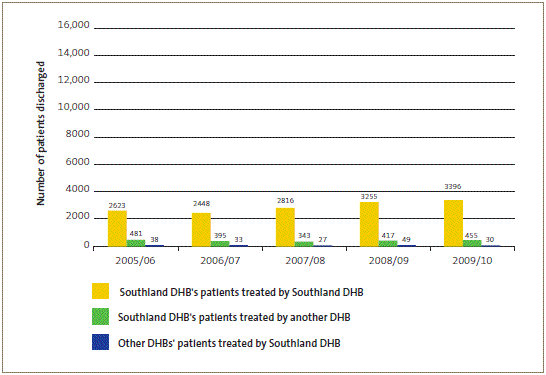
Data extracted from the National Minimum Data Set on 16 August 2010.
Tairawhiti DHB
Publicly funded scheduled surgical patients treated by Tairawhiti DHB and publicly funded scheduled surgical patients from Tairawhiti DHB treated by other DHBs, from 2005/06 to 2009/10
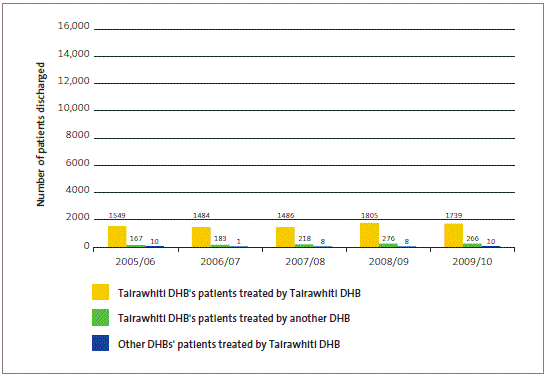
Data extracted from the National Minimum Data Set on 16 August 2010.
Taranaki DHB
Publicly funded scheduled surgical patients treated by Taranaki DHB and publicly funded scheduled surgical patients from Taranaki DHB treated by other DHBs, from 2005/06 to 2009/10
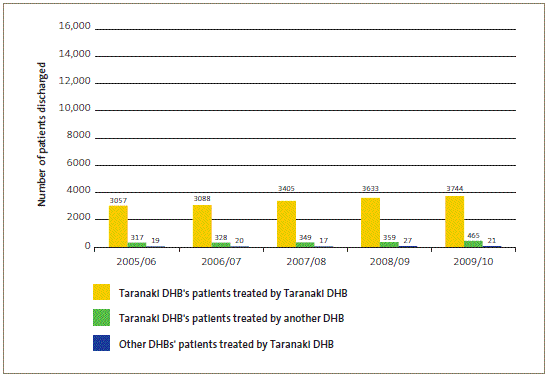
Data extracted from the National Minimum Data Set on 16 August 2010.
Waikato DHB
Publicly funded scheduled surgical patients treated by Waikato DHB and publicly funded scheduled surgical patients from Waikato DHB treated by other DHBs, from 2005/06 to 2009/10
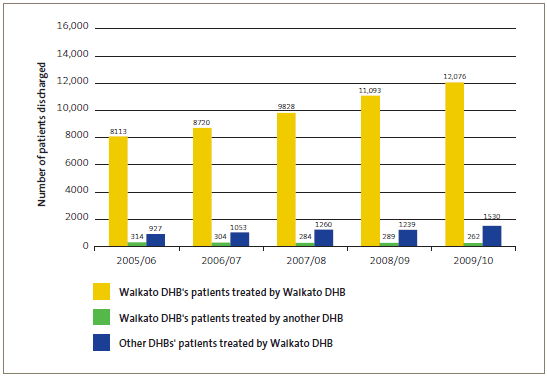
Data extracted from the National Minimum Data Set on 16 August 2010.
| During these five years, the number of its own patients who Waikato DHB treated increased by 49%. | |
In 2009/10, 11% of patients treated by Waikato DHB were from other DHBs. Of this group:
|
Wairarapa DHB
Publicly funded scheduled surgical patients treated by Wairarapa DHB and publicly funded scheduled surgical patients from Wairarapa DHB treated by other DHBs, from 2005/06 to 2009/10
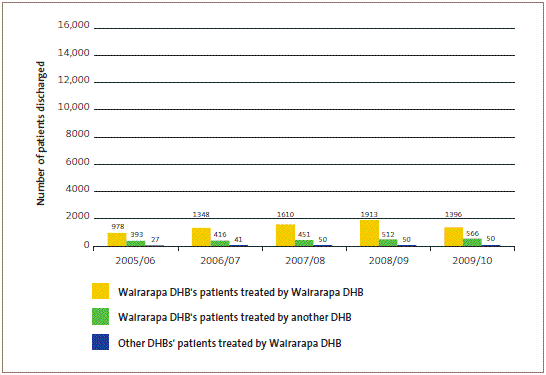
Data extracted from the National Minimum Data Set on 16 August 2010.
In 2009/10, 29% of Wairarapa DHB's patients were treated by another DHB. Of the group:
|
Waitemata DHB
Publicly funded scheduled surgical patients treated by Waitemata DHB and publicly funded scheduled surgical patients from Waitemata DHB treated by other DHBs, from 2005/06 to 2009/10
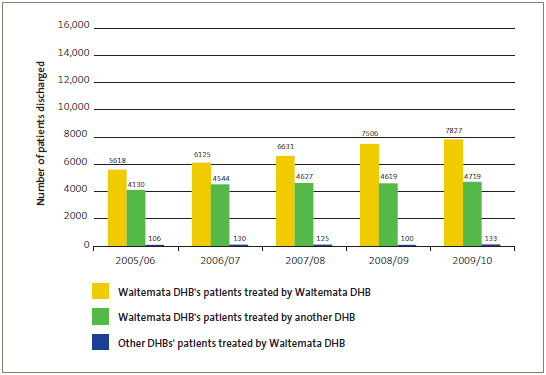
Data extracted from the National Minimum Data Set on 16 August 2010.
| During these five years, the number of its own patients who Waitemata DHB treated increased by 39%. | |
| During these five years, the number of Waitemata DHB's patients who were treated by other DHBs increased by 14%. In 2009/10, Auckland DHB treated 91% of this group. During these five years, because Waitemata DHB is also treating more of its own patients, the proportion of its patients being treated by other DHBs has decreased from 42% to 38%. |
West Coast DHB
Publicly funded scheduled surgical patients treated by West Coast DHB and publicly funded scheduled surgical patients from West Coast DHB treated by other DHBs, from 2005/06 to 2009/10
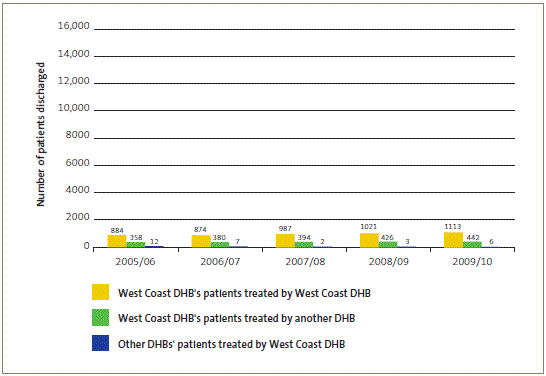
Data extracted from the National Minimum Data Set on 16 August 2010.
| In 2008/09, 28% of West Coast DHB's patients were treated by another DHB, with 91% of these patients treated by Canterbury DHB. |
Whanganui DHB
Publicly funded scheduled surgical patients treated by Whanganui DHB and publicly funded scheduled surgical patients from Whanganui DHB treated by other DHBs, from 2005/06 to 2009/10
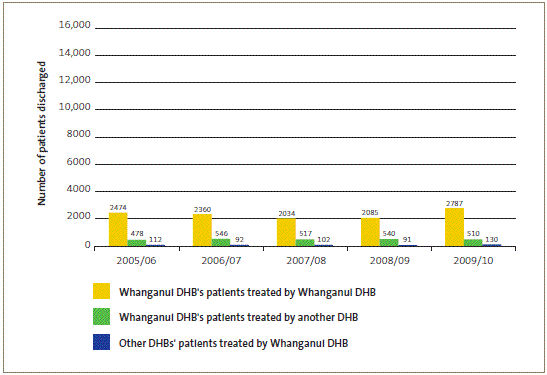
Data extracted from the National Minimum Data Set on 16 August 2010.
page top
