Part 3: Progress against our outcomes and strategic intentions
The outcomes we seek to influence are:
- Parliament and New Zealanders have trust and confidence in the public sector;
- An accountable public sector; and
- A high-performing public sector.
In 2016/17, we mostly maintained or improved the outcomes that we seek to influence.
| Outcome 1: Parliament and New Zealanders have trust and confidence in the public sector | |
|---|---|
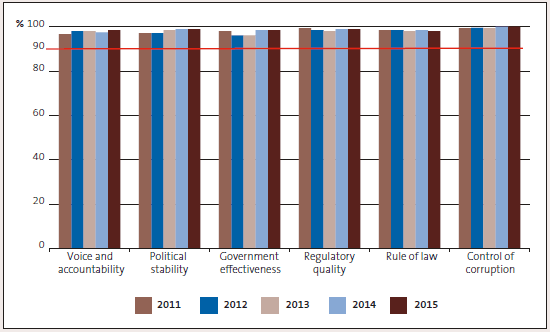
| Measure | New Zealand's ranking at or above the 90th percentile of the Worldwide Governance Indicators is improved (or at least maintained).* |
| Result | Achieved when last assessed in 2015. |
| Comment | Results for the Worldwide Governance Indicators are usually published every September for the previous calendar year. The 2016 results were not available at the time of drafting this report. |
New Zealand's ranking in the Worldwide Governance Indicators, 2011 to 2015 |
|
| Measure | The State Services Commission's Kiwis Count Survey** shows improved (or at least maintained) rates of:
|
| Result | Achieved for perception of trust. Not achieved for experience of trust. |
| Comment | The Kiwis Count Survey measures New Zealanders' trust in public services in two ways: by trust in the public service brand (perception) and by experience. Respondents rate their perception of trust in the public service brand and their trust based on their most recent public service experience. Results for the Kiwis Count Survey are now reported on a calendar year basis. They were previously reported on a financial year basis. All results for 2012-2015 have been recalculated, and some results are now slightly different to those previously published. We have aligned our reporting of Kiwis Count Survey results with the recalculated results. This means that some of the results we report this year are slightly different to results we have previously published. New Zealanders' levels of trust in the public service brand (perception) has increased to 45% (2015: 44%, 2014: 45%). Since 2012, perception of trust results have varied between 41% and 45%. New Zealanders' levels of trust in public services based on experience decreased to 79% in 2016 (2015: 81%, 2014: 78%). Since 2012, trust based on experience results have varied between 75% and 81%. |
| Measure | New Zealand's score on the Transparency International Corruption Perceptions Index*** is improved (or at least maintained) |
| Result | Achieved. |
| Comment | In 2016, New Zealand scored 9.0 out of 10 in the Transparency International Corruption Perceptions Index to rank first equal with Denmark of the 176 countries surveyed. This was an increase from 8.8 in 2015 when New Zealand's ranking dropped from second to fourth least-corrupt country of those countries surveyed. From 2010 to 2014, New Zealand's score was consistently between 9.0 and 9.5. |
* See the World Bank website, http://info.worldbank.org/governance/wgi/.
** For survey results, contact the State Services Commission, www.ssc.govt.nz.
*** See the Transparency International website, https://www.transparency.org/news/feature/corruption_perceptions_index_2016.
| Outcome 2: An accountable public sector | |||||
|---|---|---|---|---|---|
| Measure | Public sector behaviour is more responsible in the area of accountability for public resources. | ||||
| Result | Achieved, based on our assessment of results for our indicators. | ||||
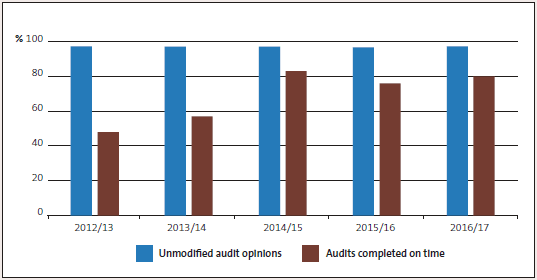
| Comment | Holding public entities accountable for their use of public resources is a fundamental part of our work. Indicators of responsible behaviour in relation to accountability for public resources include timely and reliable information, sound management, and good governance. Each year, we examine trends for these aspects of public sector behaviour to assess an overall outcome for this measure. Overall, we consider that the results for these indicators show that public sector behaviour in the area of accountability for public resources is improving. We use audits completed on time as a proxy for the timeliness of public entities in completing their financial and performance information within statutory time frames, and we use our issue of unmodified audit opinions as an indicator of the reliability of that information. This year, 80% of public entities' audit reports were signed within the statutory time frame, compared with 76% in 2015/16. We currently collect data about the timeliness of public release of annual reports only for local authorities. For 2015/16, 95% of local authority annual reports were publicly available on time (96% for 2014/15). The percentage of unmodified audit opinions remains relatively steady. This year, 97.5% of our audit opinions were unmodified, compared with 96.7% in 2015/16 and 97.3% in 2014/15. Percentage of unmodified audit opinions and audits completed on time, 2012/13 to 2016/17  Results for the central government sector (excluding schools) show an improving picture for management control environment, financial information systems and controls, and service performance information and associated systems and controls. |
||||
| Ratings for central government entities, 2012/13 to 2015/16 | |||||
| 2012/13 | 2013/14 | 2014/15 | 2015/16 | ||
| Management control environment | |||||
| Very good | 62% | 59% | 62% | 63% | |
| Good | 32% | 34% | 32% | 32% | |
| Needs improvement | 6% | 7% | 6% | 5% | |
| Financial information systems and controls | |||||
| Very good | 52% | 48% | 53% | 54% | |
| Good | 45% | 43% | 42% | 42% | |
| Needs improvement | 3% | 9% | 5% | 4% | |
| Service performance information and associated systems and controls | |||||
| Very good | 8% | 9% | 8% | 16% | |
| Good | 74% | 73% | 79% | 78% | |
| Needs improvement | 18% | 18% | 13% | 6% | |
| In 2014/15, we reported information from the three-yearly Integrity and Conduct Survey carried out by the State Services Commission (SSC) as indicators for our outcome about public sector behaviour and accountability for public resources. The SSC has not since conducted the three-yearly Integrity and Conduct Surveys, and we have not found an alternative indicator for this outcome. We understand that the SSC is working on a new approach to gathering information about integrity and conduct in the public sector. We intend to report the relevant aspects of this information when it is available. | |||||
| Outcome 3: A high-performing public sector | |
|---|---|
| Measure | The State Services Commission's Kiwis Count Survey shows improved (or at least maintained) rates of service quality for all public services. |
| Result | Not achieved |
| Comment | The overall service quality score for 2016 is 74, a one-point decrease from 75 in 2015. Overall, service quality scores have fluctuated between 72 and 75 since 2012. |
Progress against our strategic intentions
The Auditor-General's strategic intentions 2014/15 to 2017/18 was developed to guide and focus our work from 2014/15 to 2017/18. Overall, we have continued to make good progress against our four strategic goals:
- contributing to a stronger public sector;
- leading by example as a model organisation;
- demonstrating our relevance to citizens and other stakeholders; and
- positioning our Office for the future.
We have implemented projects and activities that have had long-term effects on strengthening the public sector and our own practices, lifted our citizen focus, and prepared us for the future.
We have used our unique position as the auditor of the entire public sector to help improve public sector performance and promote transparency and accountability by public entities. Specific measures and performance targets for aspects of our strategic intentions are reflected in the measures for our outcomes on pages 18-21.
We are providing greater insight and value from our audits to help improve public sector performance. For example, we brought together our insights and observations from our multi-year work on Māori education and the Canterbury Earthquake Recovery Authority to help effect change. Our reflections reports, which bring together all the lessons from each year's themed work programme, continue to be in high demand.
We have gained momentum in helping to improve Parliament's scrutiny of public sector performance through our joint project with Parliamentary staff. We now brief select committees in a more timely way about our findings and matters that need attention.
We made good progress on our "model organisation" strategic goal. To show the way for other audit offices around the world, we chose to pioneer the application of an international self-assessment framework and publicly release the results. Our project management and reporting disciplines are improving. For example, timeliness of completing the projects in our work programme is improving, but is still well under target.
Our work to connect more with citizens has progressed. For example, we prepared a video about our work on mental health that was popular on social media channels and effective in reaching more citizens. And our calls on social media for people to comment on our draft annual plan were widely shared – people were supportive of our proposed Water theme.
Our work under the "positioning our Office for the future" strategic goal has seen a significant upgrade of our financial management system. Our international recruitment activities are helping us to meet our workforce needs now and in the future. To support our ongoing discussions about the future of auditing, we commissioned independent academic research on the value of public audit. The research findings have provided helpful context as we examine likely changes in public sector auditing. We have continued to encourage and promote financial sustainability and integrated reporting in the public sector.

